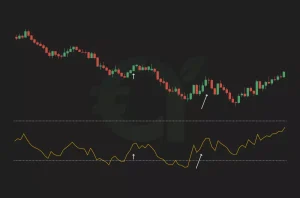
Forex charts are essential tools for trading and analyzing currencies that show the historic price value over time and present the trends in a market.
Chart Whereas images illustrate concepts, display charts offer an accurate representation of how pair currency prices change over a certain period, usually measured in pips. Besides, it makes noticeable patterns and familiarises novice traders with technical analysis.
Line Chart
A line chart is the fastest and easiest way to represent the movement of an item overtime. This type of chart turns data points into connected lines. This representation is straightforward, as well, as one can easily track the prices and the big picture.
This chart type allows for a wide range of analyses, from comparative analyses of performance between securities, markets, industry groups, and economic indicators to illustrating correlations between items in your dataset as well as seasonality in a market.
It’s worth noting, though, that interpretation of line charts involves mainly visual perception, which can lead to inaccurate interpretations. If values along the x-axis are unevenly spaced, small changes of slope might suddenly seem dramatic and baffle your viewers. For complex data subject to this error, the better solution is to pick a different chart type – perhaps bar charts – to derive a better interpretation for your data, rendering your insight even clearer to the viewer.
Bar Chart
Forex charts include indicators of how changing prices affect the course of exchange rates over a designated period of time. These charts help forex traders in making a decision on trading and increasing the winning probability on the market.
Unlike line charts which show a link among the different points each with various price, bar charts (also known as an OHLC chart) provide lots of detail for each point-it shows the opening price of a security, the highest price, lowest price and the closing price of each and every point.
The chart can also be annotated with lines or bands to help identify where the key spots with important values occur.
The important thing is that one must understand the various types of charts available and learn them in order to make a clear choice on a good trading decision. To achieve this, I have got several advices to fellow traders: you must try each and every chart available untill you will discover which suites your style and perfonality the most. Remember the slogan, never remain comitted to one type untill a good one finds you out!
Candlestick Chart
The candlestick chart gathers information about price in an illustrative diagram in as much as, during any interval, the central rectangular (called real body) zone displays opening and closing prices for a specified time frame, while the top and bottom sections, called wicks, are represented by vertical lines, indicating high and low prices respectively; in the case of closing prices exceeding the opening prices, the candle is coloured; otherwise it is empty. Candlestick patterns, if properly interpreted, may show either bullish or bearish trends.
Candlestick patterns, however, can be useful as a confirmation tool for other technical indicators such as moving averages and volume, and a good trader should be using these indicators and more together in order to get a good overview, and validate the signals from the candlestick patterns.
Moving Averages
Moving Averages help to find trends, as well as act as areas of support and resistance. You can tweak them to fit your trading style and needs by adjusting the sampling period (longer periods have more lag). However, they also risk giving a false signal a little early. In general, the longer the period to moving average, the longer the lag will be relative to the current price action of the underlying security.
Moving Averages help us assess the movement in price over a certain period of time. Two of the most commonly used are simple moving average (SMA) and exponential moving average (EMA), where the latter gives more weight to recent prices and react quicker to price changes. Whatever one you choose to use, understanding how to apply it is a valuable skill that will allow you to spot upwards or downwards momentum much quicker, helping you to capitalise on trending price action, and avoid the short-lived jerky movements of the market. Most charting and trading platforms make them even easier to use!


